


1. Basic Concepts
1.1 Identification of Items of Balance Sheet
It is identified that the main factors of the balance sheet are assets, liabilities, capital and equity. The main factors which are included in the assets are cash and cash equivalents, securities and loans. The cash and cash equivalent refers to the services of a particular bank which is useful for the supply of cash on demand. The cash includes assets which are known as reserves, excess reserves, vault cash and cash in the form of collection. The cash equivalents refer to the short term assets which are almost identical to the short term investments which can be converted into cash without any reduction of the value (Moretti, Thomas and Alexandre, 2021).
The securities of the banks refer to the bonds which can be sold at a rapid rate in several secondary markets when a particular bank requires more money. The loans provided to the consumers are a major portion of the asset for a particular bank. The main types of loans which are provided by the banks are business loans, real estate loans, consumer loans and interbank loans (ElFayoumi, 2018).
The liability process refers to the items which are the deposits from the consumer end and borrowing from other sources for the enhancement of the assets of the banks. It includes different types of items such as checkable deposits, nontransaction deposits and borrowings. The bank capital refers to the funds which are received by the owners of banks for issue of stocks. The equity process refers to the common and preferable shares for the owners of the banks (Al Hasan et al., 2019).
1.2 Interpretation of Trends in Main Items
It was identified from the consolidated balance sheet of Barclays Group Plc that the total assets for £1,349,514 million whereas the liabilities for the banking organisation is £1,282,632 million. It was further identified that the total assets for Lloyd banking group is £871.3 billion and total liabilities for the organisation £821.9 billion. The asset level for HSBC Holdings Plc is £2,984,164 million. It is further identified that the equity value for Barclays Group Plc is £65,797 million whereas the equity value for Lloyd banking group and HSBC Holdings Plc is £49.4 billion and £857,520 million respectively (Lloyd Group Plc, 2021; HSBC, 2021; Barclays Group Plc, 2021). It is identified that the majority of the banks in the UK witnessed a major liability. It was further noticed that the management of the organisations faced challenges due to low interest rates, net interest margins, operating methods and others. Therefore, the management of the banking organisations has developed the productivity of different investment practices and loan delivery activities which is effective for the maintenance of financial activities in this tough global pandemic situation (Garbutt, 2021).
1.3 Maturity of Banks
It was identified that around 32 percent of the gross debt level of the banking sector of the UK is delivered with the reserves of the central bank of the UK. The amount of gilts purchased by the professionals of the banking sector of the UK have a maturity of around 13 years (Bank of England, 2021).
1.4 Risk Transformation in Country
It was identified that the three major risks implemented by the banking sector of the UK are market risks, credit risks and operational risks. The market risks refers to the exposure of the activities which are related to different types to risks and changes in the external financial market. It occurs as the management of the banks possess a wide range of financial assets such as shares, bonds and others for the banking organisations and the consumers. The credit risk process indicates the failure in the payment for the debts which pose a significant risk for the banking sector of the UK. Finally, the operational risks identify the vulnerability of the activities for human errors and mistakes. The main losses which occur due to the inaccurate internal processes, external events and practices and information leaking practices (de Araujo et al., 2020).
2. Profitability and Risk Analysis
2.1 Profitability Ratio Analysis
The main ratios which are included in the profitability activities are net interest margin, loan to assets ratio and return to assets ratio. The net interest margin identifies the difference between the generated interest income and income expenses. The loan to asset ratio identifies the overall loan which is measured as the total loans as a percentage of the total assets. The return to assets ratio identifies the overall income which is generated from the operation of the asset present in the organisations.

It is identified from the consolidated balance sheet of Barclays PLC in 2020 that the net interest margin is 2.61%. The net interest income for Lloyd Banking Group is 2.52% whereas the value for HSBC Holdings Plc is 1.32%. The loan to asset ratio for Barclays Plc, Lloyd Banking Group and HSBC Holdings Plc is 0.25, 0.03 and 0.34. The return to asset ratio for Barclays Plc, Lloyd Banking Group and HSBC Holdings Plc is 0.004, 0.033 and 0.011(Lloyd Group Plc, 2021; HSBC, 2021; Barclays Group Plc, 2021).
| 2020 | 2019 | 2018 | 2017 | 2016 | |
| Loan | 342632 | 339115 | 326406 | 324048 | 345900 |
| Assets | 1349514 | 1140229 | 1133283 | 1133248 | 1213126 |
| Net income | 8122 | 3941 | 3815 | 6086 | 6048 |
| Loan to Asset | 0.25 | 0.30 | 0.29 | 0.29 | 0.29 |
| Return to Asset | 0.006 | 0.003 | 0.003 | 0.005 | 0.005 |
Table 1: Analysis of Profitability Ratio of Barclays Plc
(Source: Barclays Group Plc, 2021)
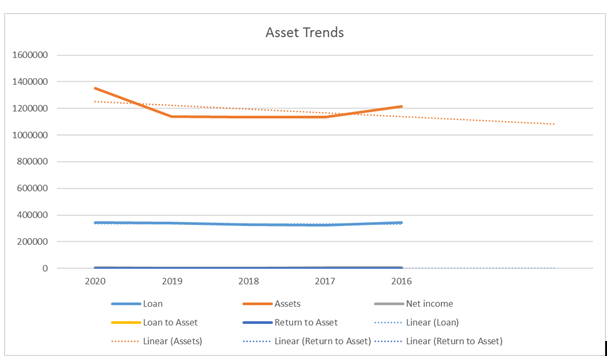
Figure 1: Asset Trends of Barclays Plc
(Source: Barclays Group Plc, 2021)
| 2020 | 2019 | 2018 | 2017 | 2016 | |
| Loan | 498843 | 494988 | 484858 | 472498 | 457958 |
| Assets | 871269 | 833893 | 797598 | 812109 | 817793 |
| Net income | 8384 | 9184 | 3004 | 3030 | 11435 |
| Loan to Asset | 0.57 | 0.59 | 0.61 | 0.58 | 0.56 |
| Return to Asset | 0.010 | 0.011 | 0.004 | 0.004 | 0.014 |
Table 2: Analysis of Profitability Ratio of Lloyd Plc
(Source: Lloyd Group Plc, 2021)
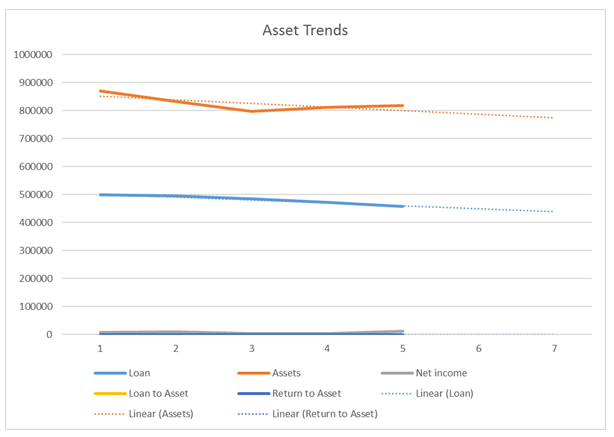
Figure 2: Asset Trends of Lloyd Plc
(Source: Lloyd Group Plc, 2021)
| 2020 | 2019 | 2018 | 2017 | 2016 | |
| Loan | 1037987 | 1036743 | 981696 | 962964 | 861504 |
| Assets | 2984164 | 2715152 | 2558124 | 2521771 | 2374986 |
| Net income | 22578 | 30462 | 30489 | 28176 | 29813 |
| Loan to Asset | 0.35 | 0.38 | 0.38 | 0.38 | 0.36 |
| Return to Asset | 0.008 | 0.011 | 0.012 | 0.011 | 0.013 |
Table 3: Analysis of Profitability Ratio of HSBC Group Plc
(Source: HSBC, 2021)
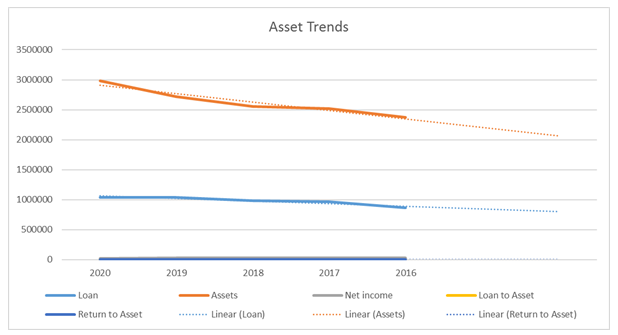
Figure 3: Asset Trends for HSBC Group Plc
(Source: HSBC, 2021)
2.2 Risk Ratio Analysis
The main ratios which are calculated for the analysis of risks in a particular bank are efficiency ratio, operating leverage, liquidity coverage ratio and leverage ratio. The efficiency ratio indicates the efficiency in different operating activities of the banks. The ratio is obtained by dividing the non-interest expense with the revenue. The operating leverage process assesses the comparison between the growth of revenue and growth of non-interest expenses. The ratio for liquidity coverage identifies the liquidity of a bank and measures the capability of a specific bank to fulfill the short term obligations without any access for external cash. Finally, the leverage ratio measures the capability of a bank to cover the exposures with the help of tier 1 capital.
| 2020 | 2019 | 2018 | 2017 | 2016 | |
| Common Equity Tier 1 Ratio | 15.10% | 13.80% | 13.20% | 13.30% | 14.10% |
| Cost Income Ratio | 63% | 63% | 66% | 64% | 64% |
| Group Return on Tangible Equity | 3.40% | 9.00% | 8.50% | 7.10% | 3.60% |
Table 4: Analysis of Risk Ratio of Barclays Plc
(Source: Barclays Group Plc, 2021)
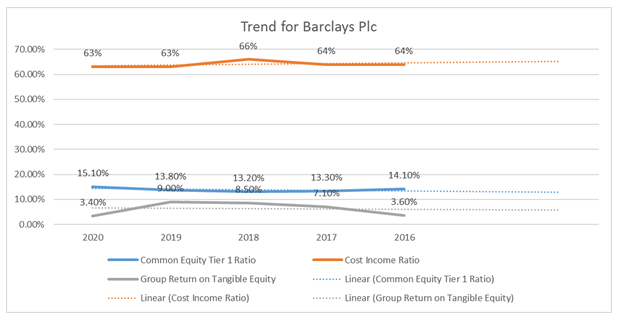
Figure 4: Analysis of Risk Ratio of Barclays Plc
(Source: Barclays Group Plc, 2021)
| 2020 | 2019 | 2018 | 2017 | 2016 | |
| Common Equity Tier 1 Ratio | 16.20% | 13.80% | 13.90% | 13.90% | 13% |
| Cost Income Ratio | 55.30% | 48.50% | 49.30% | 51.80% | 55.30% |
| Group Return on Tangible Equity | 3.70% | 7.80% | 11.70% | 8.90% | 6.60% |
Table 5: Analysis of Risk Ratio of Lloyd Group Plc
(Source: Lloyd Group Plc, 2021)
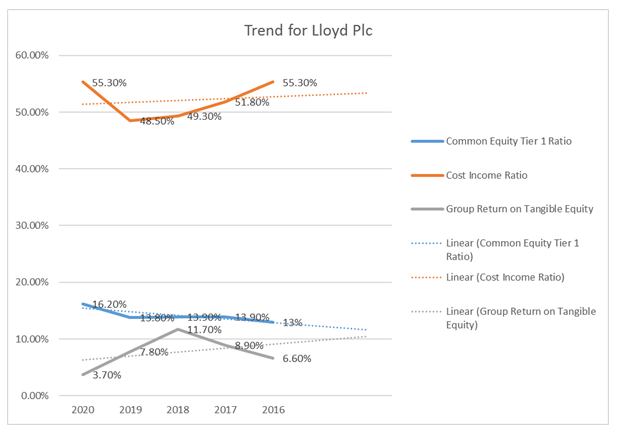
Figure 5: Analysis of Risk Ratio of Lloyd Group Plc
(Source: Lloyd Group Plc, 2021)
| 2020 | 2019 | 2018 | 2017 | 2016 | |
| Common Equity Tier 1 Ratio | 15.90% | 14.70% | 14% | 13.60% | 11.90% |
| Cost Income Ratio | 68.30% | 75.50% | 64.40% | 63.30% | 46.60% |
| Group Return on Tangible Equity | 3.10% | 8.40% | 8.60% | 8.75% | 6.45% |
Table 6: Analysis of Risk Ratio of HSBC Group Plc
(Source: HSBC, 2021)

Figure 6: Analysis of Profitability Ratio of HSBC Group Plc
(Source: HSBC, 2021)
3. Empirical Analysis
The banking sector’s profitability are measured by using several metrics such as ROA (return on assets), NIIM (net interest margin) and others (Kamruzzaman, 2019). These ratios might be used as profitability indicators of the specific bank for different periods. In this context, statistical testing is conducted for checking the determinants of ROA of three banks – Lloyds, Barclays and HSBC for the last five years. The macro-economic indicators such as inflation, GDP and unemployment are used as control variables for this test. According to a report published in Federal Deposit Insurance Corporation (FDIC) in 2012, the unemployment rate is considered as the negative determinant on the ROA of the banks (Kupiec and Lee, 2021). On the other hand, Wito (2017) has explained that unemployment as an influencing factor on the profitability measure of the banks. Demirgüç-Kunt and Huizinga (2010) have used a log of total assets as the proxy of a firm’s size in their research. Therefore, the firm size is expressed with the proxy log of total assets in this study also. Pointer, L.V. and Khoi (2019) have found that ROA has been significantly influenced for the banks during the financial crisis. Kamruzzaman (2019) has supported the internal determinants as his study has observed significant influence of loan to asset, NIIM, cost to income, return on tangible equity and common equity return on profitability of the banks.
| SUMMARY OUTPUT | ||||||||
| Regression Statistics | ||||||||
| Multiple R | 1 | |||||||
| R Square | 1 | |||||||
| Adjusted R Square | 65535 | |||||||
| Standard Error | 0 | |||||||
| Observations | 5 | |||||||
| ANOVA | ||||||||
| df | SS | MS | F | Significance F | ||||
| Regression | 8 | 1.09E-05 | 1.37E-06 | #NUM! | #NUM! | |||
| Residual | 0 | 0 | 65535 | |||||
| Total | 8 | 1.09E-05 | ||||||
| Coefficients | Standard Error | t Stat | P-value | Lower 95% | Upper 95% | Lower 95.0% | Upper 95.0% | |
| Intercept | 1.19349 | 0 | 65535 | #NUM! | 1.19349 | 1.19349 | 1.19349 | 1.19349 |
| Unemployment Rate | -0.00568 | 0 | 65535 | #NUM! | -0.00568 | -0.00568 | -0.00568 | -0.00568 |
| GDP Per Capita | -0.04114 | 0 | 65535 | #NUM! | -0.04114 | -0.04114 | -0.04114 | -0.04114 |
| Inflation | -0.32426 | 0 | 65535 | #NUM! | -0.32426 | -0.32426 | -0.32426 | -0.32426 |
| Loan to Asset | 0 | 0 | 65535 | #NUM! | 0 | 0 | 0 | 0 |
| Common Equity Tier 1 Ratio | 0 | 0 | 65535 | #NUM! | 0 | 0 | 0 | 0 |
| Cost Income Ratio | 0 | 0 | 65535 | #NUM! | 0 | 0 | 0 | 0 |
| Group Return on Tangible Equity | 0 | 0 | 65535 | #NUM! | 0 | 0 | 0 | 0 |
| Firm’s size | -0.05046 | 0 | 65535 | #NUM! | -0.05046 | -0.05046 | -0.05046 | -0.05046 |
Table 7: Regression Analysis
Source: (Self-created)
The regression test of the variables has shown that loan to asset, common equity tier 1 ratio, cost to income ratio and group return on tangible equity do not have any significant influence on return on assets. The total assets have negative impact on the profitability of the banks. The result has shown negative impact of unemployment, inflation rate and GDP per capita on the bank’s performance. The firm’s size of the bank (assets) is the only internal determinant, which has shown negative association with the profitability of the banks. Other internal determinants of Lloyds, Barclays and HSBC have shown no influence or relationship with the bank’s profitability. On the other hand, the macro-economic factors such as unemployment (laggard of economy), GDP per capita (economic income) and inflation have negative influence over the banks’ profitability. Thus, the result of this study has deferred result from previous studies including all internal and exogenous factors of profitability.